How to make two plots side by side and create different size subplots in python using matplotlib
In this post we will see how to plot multiple sub-plots in the same figure.
We will follow the following steps to create matplotlib subplots:
-
Plot the two graphs vertically using matplotlib subplot
-
Plot the two graphs horizontally side by side
-
Plot four graphs in one figure
-
Sharing axes in subplots
-
Create subplots using gridspec
Vertically stacked subplots
First, we will create some random x and y values to plot on the charts
import matplotlib.pyplot as plt
import numpy as np

# Some example data to display
x = np.linspace(0.0, 5.0, 100)
y = np.cos(2*np.pi*x) * np.exp(-x)
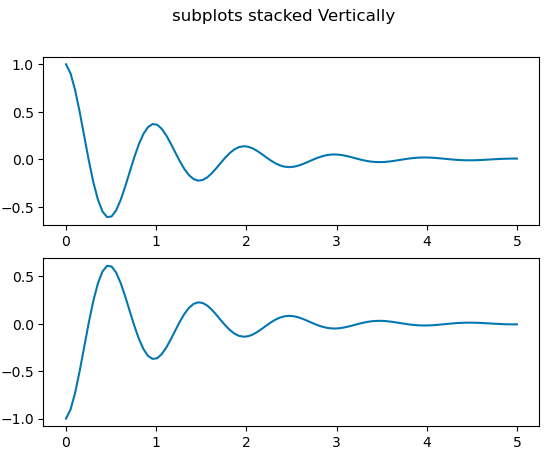
We will use subplots to create common layouts of subplots, including the enclosing figure object.
The first two arguments of subplots defines the number of rows and columns of subplot grid, we have just passed the row argument as 2 here.
fig, axs = plt.subplots(2)
fig.suptitle('subplots stacked vertically')
axs[0].plot(x, y)
axs[1].plot(x, -y)
Plots side by side - Horizontally stacked
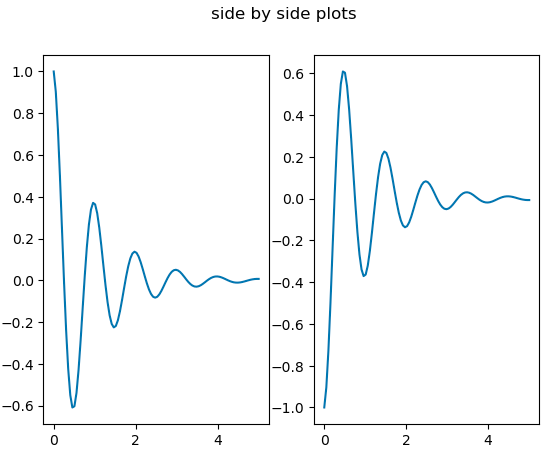
To plot the subplots side by side, we will pass row as 1 and column as 2 (plt.subplots(1,2))
fig, (ax1, ax2) = plt.subplots(1, 2)
fig.suptitle('Horizontally stacked subplots')
ax1.plot(x, y)
ax2.plot(x, -y)
Group of subplots - 2x2
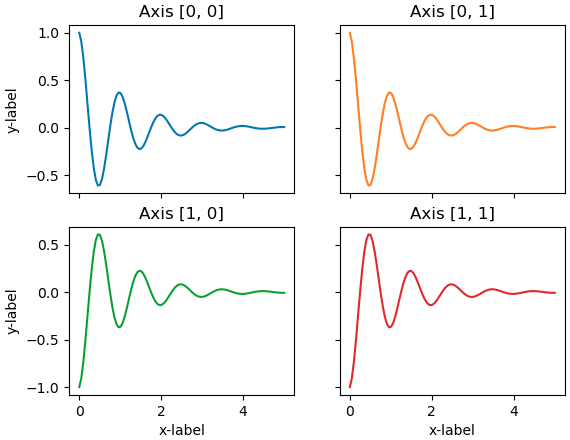
In most cases we want to plot multiple subplots in the same figure. Here we will plot 2 graphs in each row and column
fig, axs = plt.subplots(2, 2)
axs[0, 0].plot(x, y)
axs[0, 0].set_title('Axis [0, 0]')
axs[0, 1].plot(x, y, 'tab:orange')
axs[0, 1].set_title('Axis [0, 1]')
axs[1, 0].plot(x, -y, 'tab:green')
axs[1, 0].set_title('Axis [1, 0]')
axs[1, 1].plot(x, -y, 'tab:red')
axs[1, 1].set_title('Axis [1, 1]')

for ax in axs.flat:
    ax.set(xlabel='x-label', ylabel='y-label')

for ax in axs.flat:
    ax.label_outer()
Subplots using gridspec
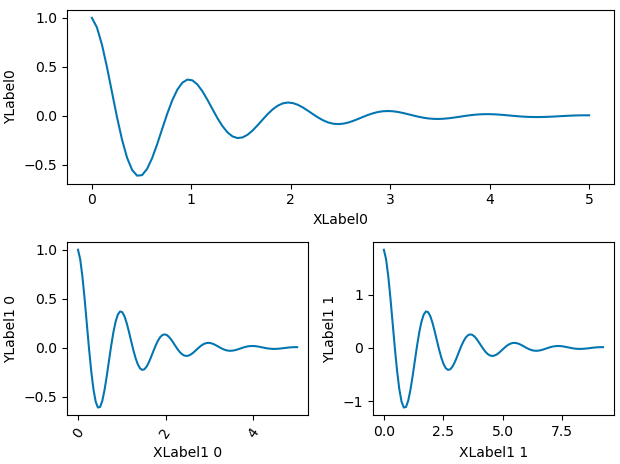
Here we are using Gridspec to create three subplots in one figure.
Gridspec helps to control the position of the subplots by creating a Gridspec and then call it’s subplots method
import matplotlib.pyplot as plt
import numpy as np
import matplotlib.gridspec as gridspec

fig = plt.figure(tight_layout=True)
gs = gridspec.GridSpec(2, 2)

ax = fig.add_subplot(gs[0, :])
ax.plot(x, y)
ax.set_ylabel('YLabel0')
ax.set_xlabel('XLabel0')

for i in range(2):
    ax = fig.add_subplot(gs[1, i])
    ax.plot(x*(np.sin(i)+1) , y*(np.sin(i)+1) )
    ax.set_ylabel('YLabel1 %d' % i)
    ax.set_xlabel('XLabel1 %d' % i)
    if i == 0:
        ax.tick_params(axis='x', rotation=55)
fig.align_labels()  # same as fig.align_xlabels(); fig.align_ylabels()

plt.show()
Sharing axes with multiple subplots
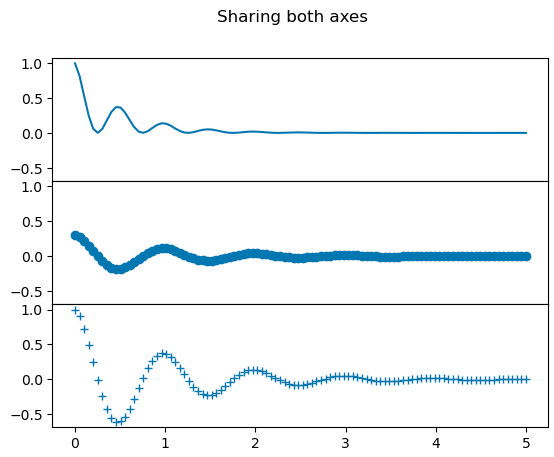
Instead of having axes for each subplots we could have same x and y axes for all the subplots
fig = plt.figure()
gs = fig.add_gridspec(3, hspace=0)
axs = gs.subplots(sharex=True, sharey=True)
fig.suptitle('Sharing both axes')
axs[0].plot(x, y ** 2)
axs[1].plot(x, 0.3 * y, 'o')
axs[2].plot(x, y, '+')

# Hide x labels and tick labels for all but bottom plot.
for ax in axs:
    ax.label_outer()
Sharing x-axis per column and y-axis per row
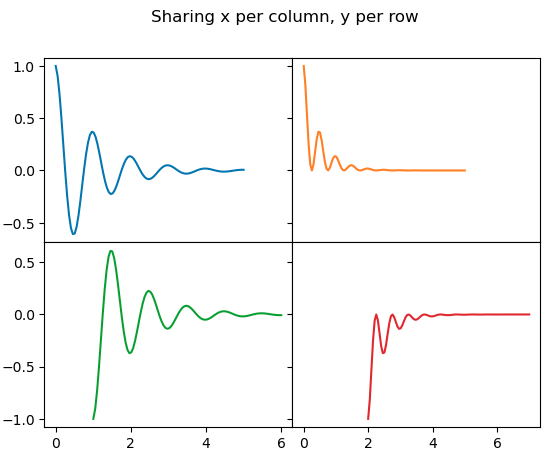
Alternatively, you could also choose to use the same x and y axis for two or more subplots. Here we are using gridspec to create the subplots
fig = plt.figure()
gs = fig.add_gridspec(2, 2, hspace=0, wspace=0)
(ax1, ax2), (ax3, ax4) = gs.subplots(sharex='col', sharey='row')
fig.suptitle('Sharing x per column, y per row')
ax1.plot(x, y)
ax2.plot(x, y**2, 'tab:orange')
ax3.plot(x + 1, -y, 'tab:green')
ax4.plot(x + 2, -y**2, 'tab:red')

for ax in fig.get_axes():
    ax.label_outer()
