matplotlib fill color between vertical, horizontal lines and polygon
In this post, we will learn how to fill color in the matplotlib charts between two vertical or Horizaontal lines and also inside the Polygons
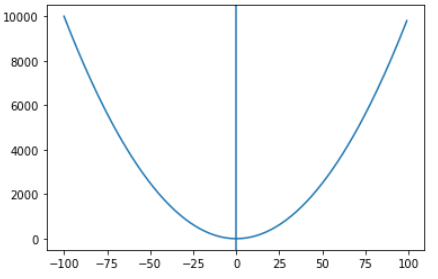
First we will create a parabola and then will see how to fill the parabola with different colors using fill_between
import matplotlib.pyplot as plt
import numpy as np

x = np.arange(-100,100,1)
y = x**2

plt.plot(x,y)
plt.axvline(x=0)
Matplotlib fill_between
Matplotlib.pyplot.fill_between fills the area between two horizontal curves
The fill_between takes three parameters x, y1 and y2, where x is the x coordinate and y1 and y2 are y min and y max of the curve respectively
There is another parameter where to define where to exclude some horizontal regions, We will see some examples in this post on how to fill color based on conditions
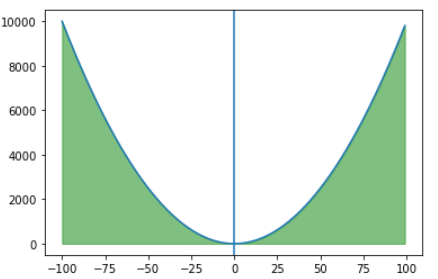
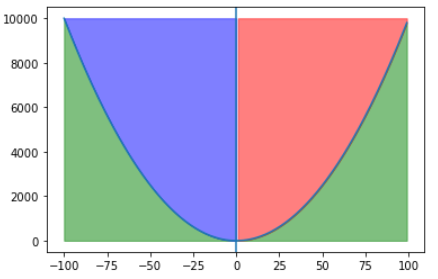
Fill outside the Parabola
We want to fill the area between the x and y i.e. outside the parabola
you can change the color transparency using kwarg alpha, which is set to 0.5 here
plt.fill_between(x, y,color='g',alpha=.5)
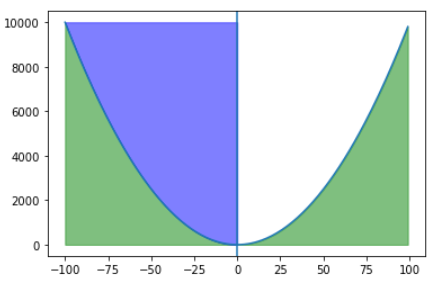
Fill inside the Parabola - Left half
We want to fill inside the parabola and the left half only i.e. left of vertical line in the middle. There is a condition here that the value of x should be below 0 and max value of y is 10000
matplotlib fill_between function provides where parameter that let you define where to exclude some horizontal regions from being filled
The filled regions are defined by the coordinates x[where]. More precisely, fill between x[i] and x[i+1] if where[i] and where[i+1]
So we have passed the y-max value as 10000 and a where condition x<0
plt.fill_between(x,y, 10000,where=x<=0,color='b',alpha=.5)
Fill inside the Parabola - Right half
We want to fill inside the parabola and the right half only i.e. right of vertical line in the middle. There is a condition here that the value of x should be above 0 and max value of y is 10000
So we have passed the y-max value as 10000 and a where condition x>0
plt.fill_between(x, y,color='g',alpha=.5)
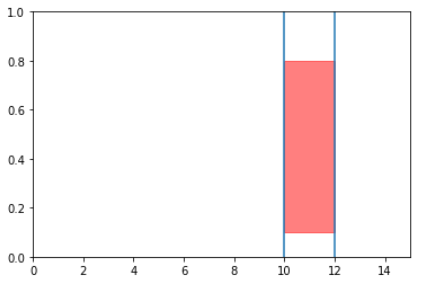
Matplotlib axvspan
axvspan let you add a vertical span(rectangle) across the axes
Here we are adding a vertical span between x limit 10 to 12, this x values are the data points
and y limit from 0.1 to 0.8, the y-limit has to be specified between 0-1
fig, ax = plt.subplots()

ax.set_xlim([0,15])
ax.axvline(x=10)
ax.axvline(x=12)
ax.axvspan(10, 12,0.1,0.8, alpha=0.5, color='red')

plt.show()
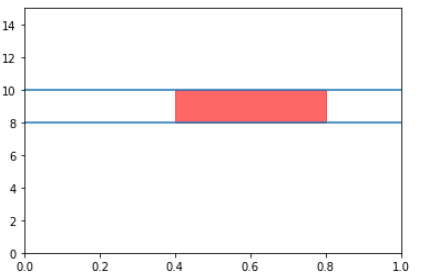
Matplotlib axhspan
axhspan let you add a horizontal span(rectangle) across the axes
Here we are adding a horizontal span between y limit 8 to 10, this y values are the data points
and x limit from 0.4 to 0.8, the x-limit has to be specified between 0-1
fig, ax = plt.subplots()

ax.set_ylim([0,15])
ax.axhline(y=8)
ax.axhline(y=10)

ax.axhspan(8, 10,0.4,0.8,color='red',alpha=0.6)

plt.show()
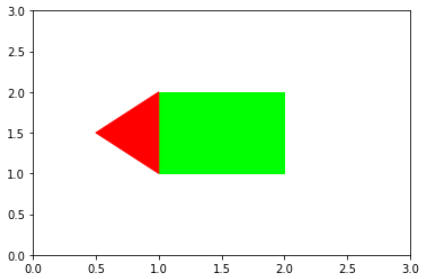
Matplotlib fill Polygon
First we will create two polygons using matplotlib.patches.polygon, it is used for creating the polygon patch. you can pass the list of vertices of numpy array with shape Nx2
While creating the polygon you can pass the color value to define the color of the polygon patch
Now matplotlib.collections.PatchCollection is a class used for generic collection of patches and you can also assign a color map to a heterogeneous collection of patches using cmap, In this case we are using match_original True because we want to use the original color of the polygon defined at time of polygon creation
import numpy as np
import matplotlib.pyplot as plt
from matplotlib.patches import Polygon
from matplotlib.collections import PatchCollection
patches = []

y1 = np.array([[1,1], [1,2], [0.5,1.5]])
y2 = np.array([[1,1], [1,2], [2,2],[2,1]])

p1 = Polygon(y, color=[0, 1, 0])
p2 = Polygon(y1, color=[1, 0, 0])

patches.append(p1)
patches.append(p2)

p=PatchCollection(patches, match_original=True)
fig,ax = plt.subplots()

ax.add_collection(p)

ax.set_xlim([0,3])
ax.set_ylim([0,3])
plt.show()