Color Columns, Rows & Cells of Pandas Dataframe
I always wanted to highlight the rows,cells and columns which contains some specific kind of data for my Data Analysis. I wanted to Know which cells contains the max value in a row or highlight all the nan’s in my data. and Pandas has a feature which is still development in progress as per the pandas documentation but it’s worth to take a look.
You can apply conditional formatting, the visual styling of a DataFrame depending on the data within, by using the DataFrame.style property. This is a property that returns a Styler object, which has useful methods for formatting and displaying DataFrames.
The styling is accomplished using CSS. You write “style functions” that take scalars, DataFrames or Series, and return like indexed DataFrames or Series with CSS “attribute: value” pairs for the values. These functions can be incrementally passed to the Styler which collects the styles before rendering.
Highlight the entire row in Yellow where Column B value is greater than 1
import pandas as pd
import numpy as np

np.random.seed(24)
df = pd.DataFrame({'A': np.linspace(1, 10, 10)})

df = pd.concat([df, pd.DataFrame(np.random.randn(10, 4), columns=list('BCDE'))],
               axis=1)
df.iloc[0, 2] = np.nan

def highlight_greaterthan(s,column):
    is_max = pd.Series(data=False, index=s.index)
    is_max[column] = s.loc[column] >= 1
    return ['background-color: red' if is_max.any() else '' for v in is_max]

def highlight_greaterthan_1(s):
    if s.B > 1.0:
        return ['background-color: yellow']*5
    else:
        return ['background-color: white']*5


df.style.apply(highlight_greaterthan_1, axis=1)

Color code the text having values less than zero in a row
def color_negative_red(val):
    color = 'red' if val < 0 else 'black'
    return 'color: %s' % color

df.style.applymap(color_negative_red)

Highlight the Specific Values or Cells
We can’t use .applymap anymore since that operated elementwise. Instead, we’ll turn to .apply which operates columnwise (or rowwise using the axis keyword)
import pandas as pd
import numpy as np

def highlight_max(s):
    is_max = s == s.max()
    return ['background-color: red' if v else '' for v in is_max]

df.style.apply(highlight_max)

Highlight all Nulls in My data
df.style.highlight_null(null_color='green')

Heatmap Styling
Styler.background_gradient takes the keyword arguments low and high. Roughly speaking these extend the range of your data by low and high percent so that when we convert the colors, the colormap’s entire range isn’t used. This is useful so that you can actually read the text still
import seaborn as sns

cm = sns.light_palette("red", as_cmap=True)

df.style.background_gradient(cmap='viridis')

Styler.set_properties
df.style.set_properties(**{'background-color': 'black',
                            'color': 'lawngreen',
                            'border-color': 'white'})

Bar charts in DataFrame
df.style.bar(subset=['A', 'B'], color='#d65f5f')

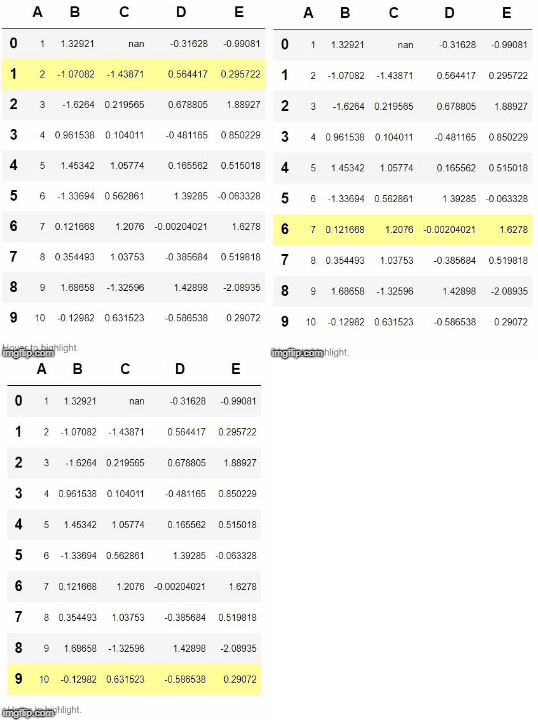
Table Style
from IPython.display import HTML

def hover(hover_color="#ffff99"):
    return dict(selector="tr:hover",
                props=[("background-color", "%s" % hover_color)])

styles = [
    hover(),
    dict(selector="th", props=[("font-size", "150%"),
                               ("text-align", "center")]),
    dict(selector="caption", props=[("caption-side", "bottom")])
]
html = (df.style.set_table_styles(styles)
          .set_caption("Hover to highlight."))
html

Check out this link for more details on Pandas Style Documentation: https://pandas.pydata.org/pandas-docs/stable/style.html